July 15, 2025
Healthcare Data: 5 Key Indicators of Care Quality in the AI Era
Patient experience and PREMs
Francis Robichaud
Patient Experience Technology Specialist

The quality of care goes beyond medical expertise – it also includes the patient’s experience throughout their care journey, the effectiveness of treatments, and overall patient engagement.
To ensure expectations are met, healthcare organizations benefit from measuring patient experience performance – especially in the age of artificial intelligence (AI), where technology is a true ally for continuous improvement in healthcare.
First, What Are PREMs and PROMs?
When discussing quality of care and patient experience, two data sources are particularly valuable: PREMs (Patient-Reported Experience Measures) and PROMs (Patient-Reported Outcome Measures).
➡️ PREMs measure patients’ perceptions of their care experience – welcome, communication, respect, clarity of information, etc.
➡️ PROMs, on the other hand, capture health outcomes as reported directly by patients, without clinician interpretation.
These two tools help healthcare administrators make truly patient-centered decisions – strategic decisions that improve the quality of care.
Here are 4 key indicators that Lime’s team of patient experience experts recommends measuring continuously using PREMs and PROMs.
1. Perceived Accessibility Score (PREMs)
The perceived accessibility score reflects how easy patients feel it is to access and receive the care they need, when they need it. You can rely on validated scale models such as the EQ-5D, which are commonly used.
Why measure perceived accessibility score?
This score allows administrators to visualize trends by population, region, or specialty, and to adjust service offerings accordingly. It also enables them to:
✅ Identify access barriers that may be invisible to administrators but perceived by patients (e.g., wait times, complex care pathways, inconvenient hours);
✅ Strengthen trust with patients by fostering a culture of listening and continuous improvement;
✅ Identify patient groups facing the most obstacles and implement targeted actions.
Real-world use cases of perceived accessibility score powered by AI
Here are a few concrete examples of how AI and certain tech tools can help improve care quality by measuring and leveraging perceived accessibility score:
💡 Automated extraction of accessibility-related themes from comments
Open-ended patient comments can be analyzed through automated processing to identify commonly mentioned pain points (e.g., difficulty booking appointments, lack of clarity in processes). This analysis helps guide corrective actions, even when quantitative scores don’t capture the issue.💡 Personalized follow-up reminders based on perceived accessibility
Patients who previously reported poor access to care can receive follow-up reminders tailored to their communication preferences (e.g., SMS, phone call, email). This data-driven personalization helps reduce dropouts and improve patient engagement.
2. PREMs and PROMs Questionnaire Response Rate
The response rate refers to the percentage of PREMs or PROMs questionnaires sent to patients that are completed and returned. In other words, it’s the ratio of completed to total sent questionnaires, expressed as a percentage.
Why monitor questionnaire response rates?
This rate helps measure patient engagement in evaluating their experience or health status. It also allows to:
✅ Ensure that the data is meaningful and yields reliable insights, acting as a quality benchmark;
✅ Strengthen the credibility of clinical and organizational decisions – decisions based on biased samples can lead to ineffective prioritization or improvements;
✅ Meet regulatory and funding requirements for eligibility in certain programs (such as CMS in the U.S.), which impose minimum survey response thresholds.
Real-world use cases of questionnaire response rate powered by AI
Here are some concrete ways AI and tech tools can support quality improvement by monitoring questionnaire response rates:
💡 Validating response rate before service redesign
Dashboards can identify response gaps between patient groups, and automated analytics can flag underrepresented populations. This ensures decisions are based on reliable, inclusive data before, for instance, reorganizing care pathways.💡 Data-backed investment decisions
When patient comments reveal dissatisfaction with the physical environment, automated text analysis can show how often this theme appears. A high response rate confirms the representativeness of the data, supporting investment decisions that reflect the majority experience.
3. Overall Satisfaction With the Care Experience Using PREMs
Overall patient satisfaction refers to the average satisfaction score or Net Promoter Score (NPS), which measures the likelihood that a patient would recommend the healthcare facility.
Why measure overall satisfaction with the care experience?
Patient experience is a key performance indicator for healthcare organizations. It helps to:
✅ Identify strengths and areas for improvement;
✅ Drive continuous improvement – care teams receive direct feedback to help them adjust their practices;
✅ Strengthen the facility’s reputation – higher satisfaction scores enhance its image and public perception.
Real-world use cases of satisfaction data powered by AI
Here are some examples of how technology can improve patient experience satisfaction and care quality:
💡 Automated analysis of open-ended comments
AI can automatically categorize patient comments by recurring themes (e.g., welcome, communication, wait times). This helps pinpoint key factors influencing satisfaction and allows rapid action – without manual analysis.💡 Structured comparison of scores across departments
Average satisfaction scores can be broken down by unit, specialty, or time period. This comparative view highlights performance gaps, supports quality committees in their analyses, and feeds continuous improvement plans.💡 Longitudinal tracking post-organizational initiative
Following a care pathway change (e.g., centralized scheduling, new liaison role), satisfaction score trends are monitored continuously. This tracking helps assess the perceived impact of changes and adjust actions as needed.
4. Perceived Health Status Change Rate Using PROMs
The perceived health status change rate indicates the proportion of patients who report improvement, stagnation, or deterioration in their health at different stages (e.g., pre-op, 3 months post-op, 6 months), providing a direct read on intervention impact from the patient’s perspective.
Why analyze patient-reported health status change rate?
This metric goes beyond standard clinical outcomes and sheds light on real perceived progress over time. It allows healthcare teams to:
✅ Quickly detect stagnation or worsening conditions;
✅ Personalize treatments – two patients receiving the same procedure may report very different trajectories;
✅ Prioritize more effectively – identify the most effective care pathways and refine those with weaker outcomes.
Real-world use cases of perceived health status change rate and AI
Here are some examples of how AI and technology can improve care quality using this indicator:
💡 Smart result analysis: turning data into clinical insights
PROMs data from multiple collections can be displayed through dynamic charts and tables, illustrating each patient’s progress. These visuals help clinicians quickly spot patients who aren’t improving and adjust interventions accordingly.💡 Granular analysis by functional domain
PROMs responses can be automatically grouped by health area (mobility, pain, autonomy, sleep, etc.). This breakdown helps clinicians target the specific aspects of daily life where patients perceive difficulties or progress—enabling more precise care planning.💡 Streamlined referrals to the right professionals
Data analysis can generate intelligent worklists based on identified clinical priorities. Patients showing functional decline, side effects, or emotional distress can be automatically referred to the appropriate professionals (e.g., physiotherapist, pharmacist, social worker), ensuring rapid, coordinated support.
5. Treatment Adherence Rate Using PROMs
Treatment adherence refers to the percentage of patients who correctly follow their prescribed treatment, focusing on indicators like medication intake, follow-up appointments, and application of medical advice.
Why measuring treatment adherence improves care quality
Adherence reflects patient engagement and the quality of the patient-care team relationship. It allows teams to better understand care impact and to observe:
✅ Improved health outcomes – treatment benefits are more likely to materialize when instructions are followed;
✅ Lower risk of complications due to poor management or medication misuse;
✅ Reduced misinterpretation of treatment effectiveness – a treatment may appear ineffective simply because it wasn’t followed, which could lead to unnecessary adjustments.
Real-world use cases of treatment adherence rate and AI
Here are some ways AI and technology can support improved treatment adherence and care quality:
💡 Automated reminders for home data collection
Personalized notifications can remind patients to regularly track and report vital signs (e.g., blood pressure, weight, blood glucose). These reminders support consistent adherence and give clinical teams up-to-date data to optimize care.💡 Structured pre-surgical preparation
Patients receive clear, step-by-step pre-op instructions through a digital platform. This improves adherence to preparation protocols, reduces last-minute cancellations, and lowers complication risks—contributing to better post-op outcomes.💡 Customized exercise reminders
During rehab programs, patients can receive tailored reminders aligned with their exercise plans. AI adjusts frequency and content based on the patient’s progress, encouraging consistent sessions and better functional results.
Improving Care Quality in the AI Era Thanks to Patient Experience
These 5 indicators remind us of one essential truth: to improve quality, we must first listen. With AI, this listening becomes continuous, structured, and a powerful driver of real change.
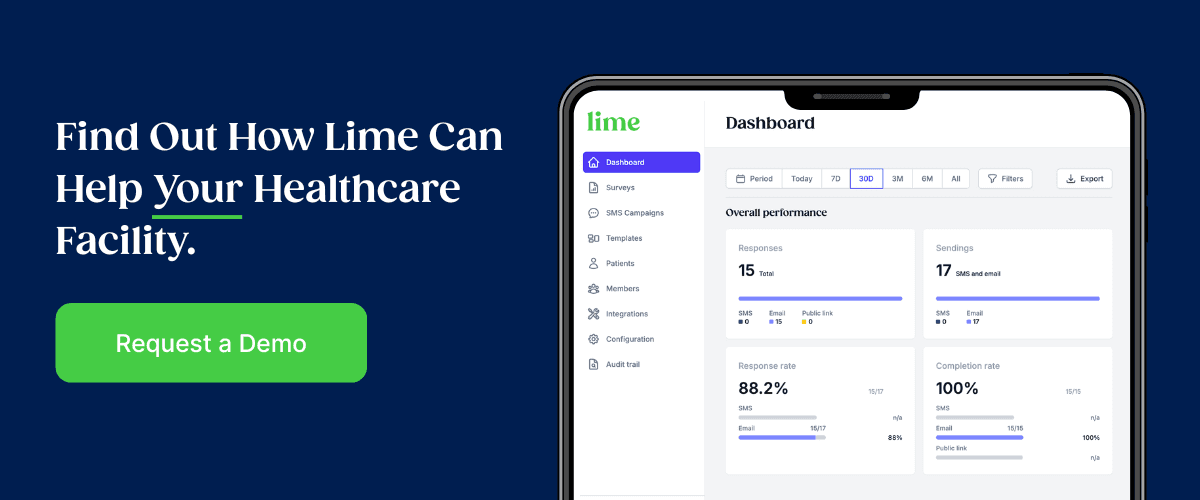
Ready to elevate your patient experience strategy? Discover how Lime’s platform empowers healthcare teams to collect, analyze, and act on what truly matters to patients.